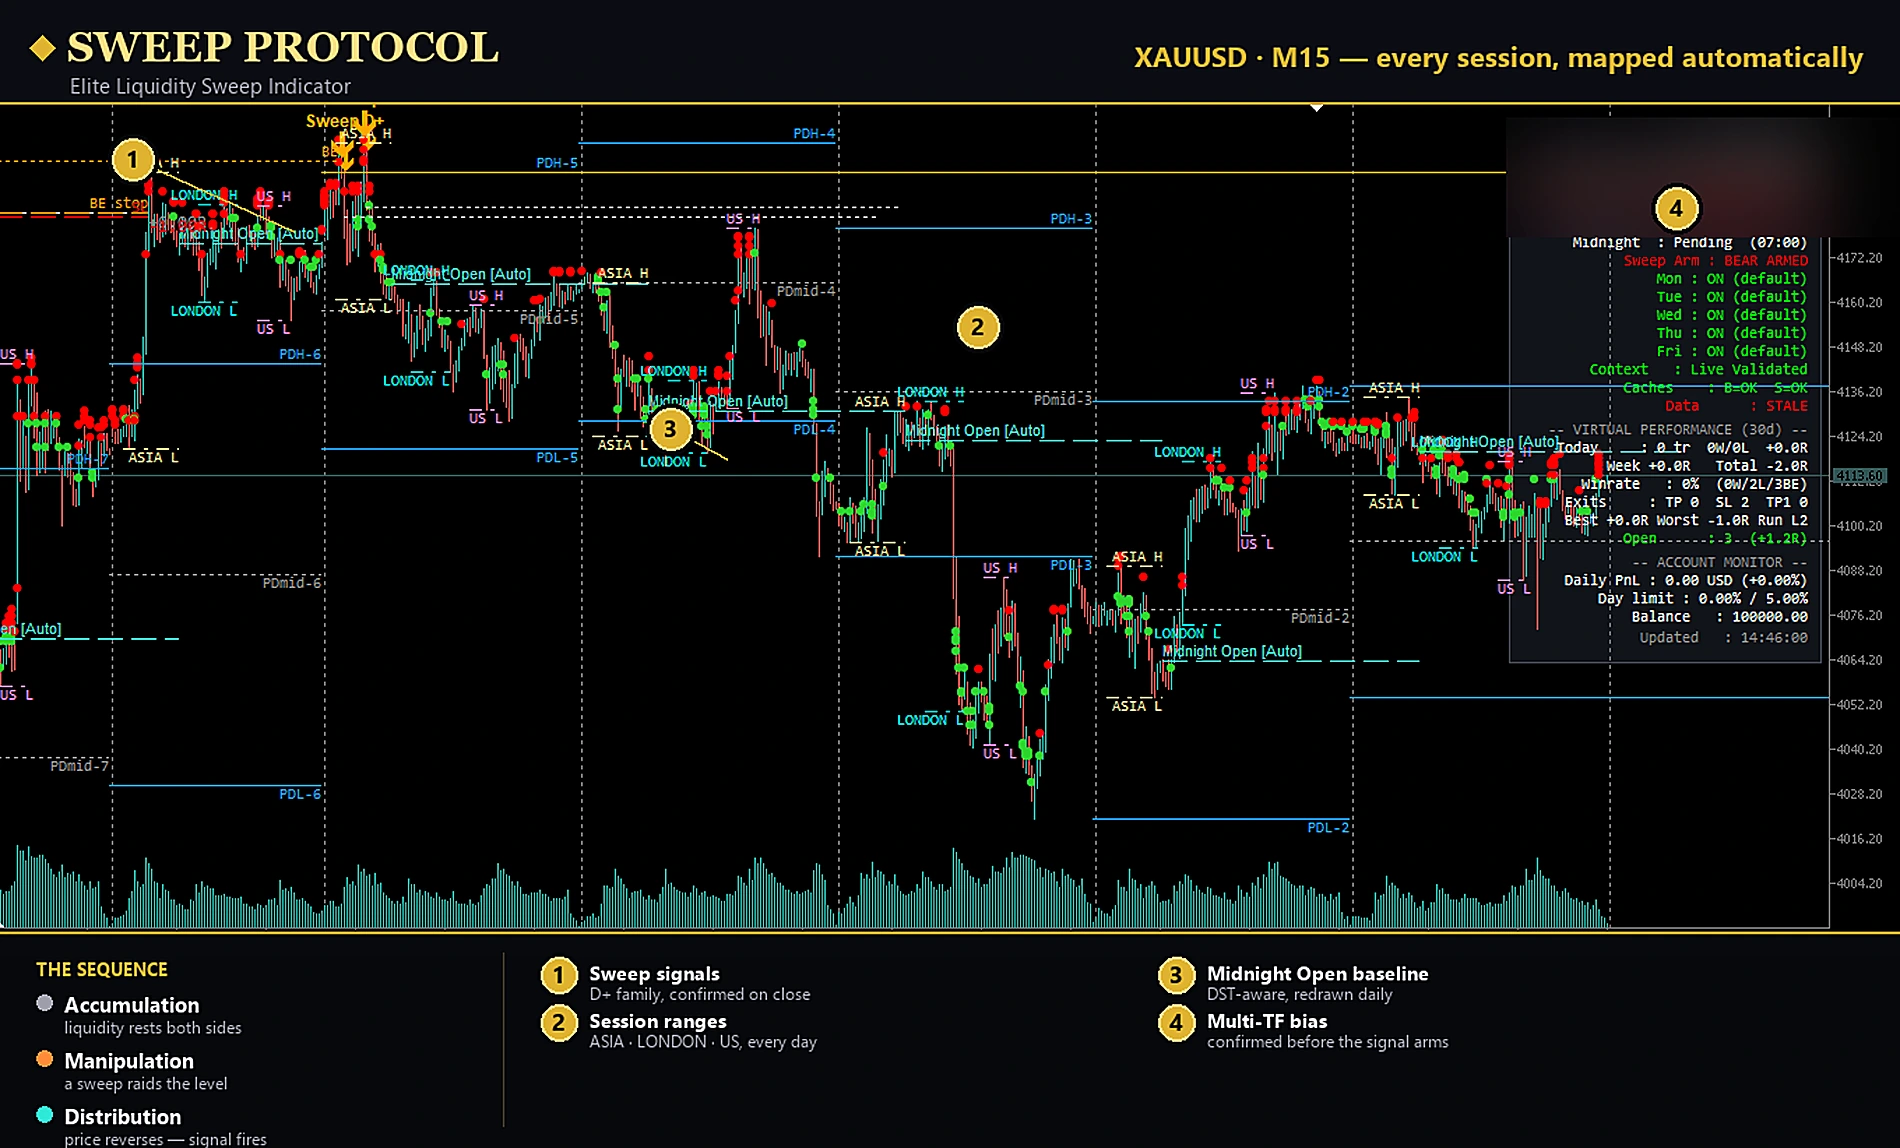
The chart as a coordinate system
Institutions do not navigate by indicators. They navigate by reference prices — the highs and lows that every desk, every algorithm and every risk system can see identically: yesterday's extremes, last week's range, the month's boundaries. These levels form a coordinate system laid over every chart in the world, and price moves between its coordinates with remarkable consistency.
Each coordinate is more than a line. Beyond every visible high sit buy stops — from shorts protecting positions and from breakout strategies waiting to chase. Beyond every visible low sit the mirror-image sell stops. In institutional language: buy-side liquidity above, sell-side liquidity below. The bigger the timeframe, the deeper the pool.
The hierarchy: daily, weekly, monthly
Previous day high / low — the intraday workhorses
Touched or swept in a majority of sessions, PDH and PDL are the default targets for any intraday thesis. A day that opens near yesterday's low and never takes it out is telling you something; a day that takes it out and instantly reclaims is telling you something louder — the classic setup dissected in the anatomy of a liquidity sweep.
Previous week high / low — the swing battleground
Weekly extremes attract multi-day positioning. Sweeps here produce reactions measured in days, not hours, and they frequently define the week's true direction by Wednesday. When an intraday signal fires at a weekly extreme, its expected value is not intraday-sized.
Previous month high / low — the campaign levels
Monthly extremes are where campaigns start and end. Price can spend weeks accepting or rejecting one level. For an intraday trader their day-to-day use is simple: know where they are, and treat any approach as an event, not a Tuesday.
Draw on liquidity: price moves from pool to pool. Your job is to know which pool is next.
Reading the map like a market maker
- Mark the coordinates daily. PDH/PDL, PWH/PWL, PMH/PML and the previous day's 50% — same routine, every day. Mechanics belong to the map, not to inspiration.
- Identify the nearest untouched pool on each side. That asymmetry is the daily bias skeleton: price gravitates toward untapped liquidity.
- Watch behaviour at the pool, not before it. Acceptance (closes beyond, continuation) versus rejection (sweep and reclaim) is decided in a handful of candles.
- Grade reactions by hierarchy. A daily-level sweep is a trade; a weekly-level sweep is a position; a monthly-level sweep is a story worth weeks of attention.
The map becomes exponentially more useful when combined with a reference for premium and discount — the Midnight Open — and with structural confirmation from order blocks. Location, valuation, confirmation: three questions, three tools.
Key takeaways
- Institutional highs and lows form a shared, objective coordinate system.
- Buy-side liquidity rests above highs, sell-side below lows — deeper with each timeframe.
- Bias = which pool is nearest and untouched; confirmation = behaviour at the pool.
- Grade every reaction by its timeframe hierarchy.
Keep the map current — always
A liquidity map is only as good as its maintenance. Levels roll over every day, week and month; miss one rollover and your coordinates are stale precisely when they matter. This is mechanical work, and mechanical work belongs to software: SWEEP PROTOCOL keeps configurable daily, weekly and monthly levels — plus equilibrium and the Midnight Open — drawn, labeled and current on every chart, so the only judgment left is the one that pays: what price does when it arrives.